Diagnosing WebRTC ICE Connectivity by Candidate and Path Evidence
Separate candidate gathering, signaling delivery, pair checks, and selected-path evidence to narrow WebRTC connectivity failures without overclaiming what a stats dump proves.
Publication & corrections: infostoa · Editorial standards
Individual author and specialist reviewer information is not provided for this article.
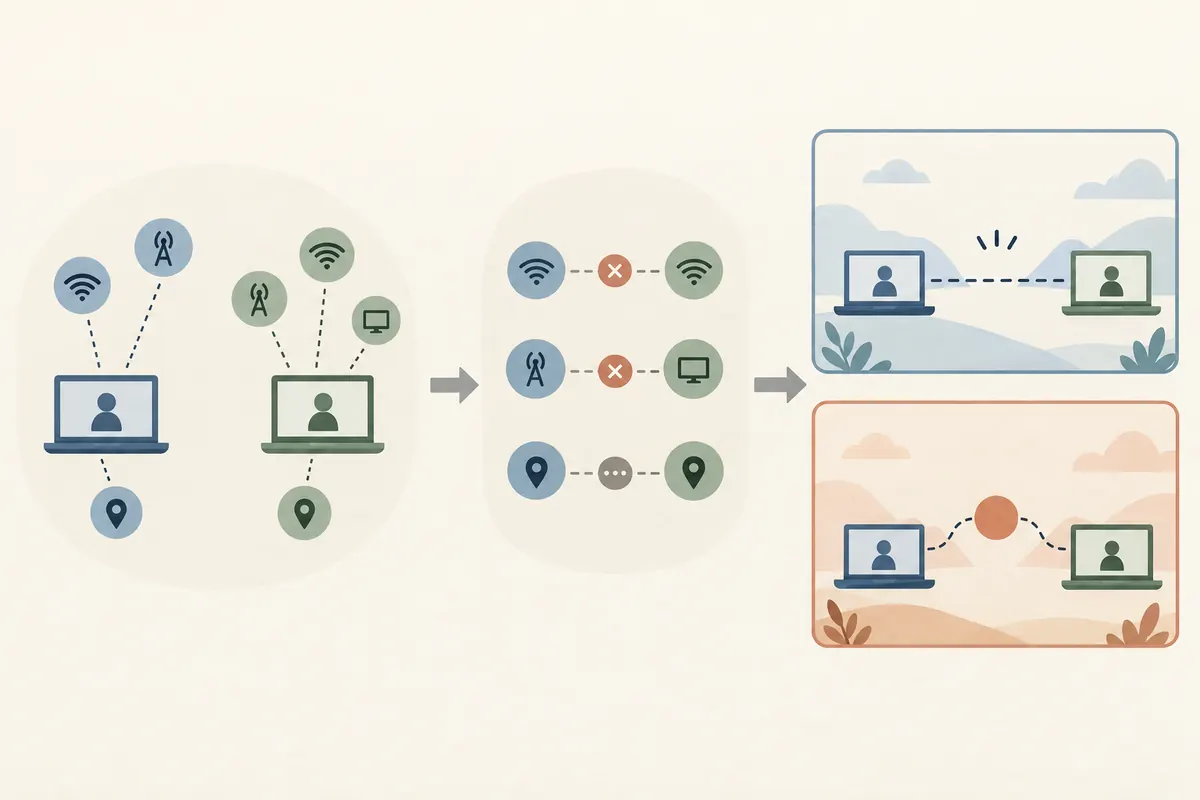
When a WebRTC call fails, “the firewall” is not a diagnosis. ICE connectivity depends on candidate gathering, delivery of remote candidates through the application’s signaling path, connectivity checks on candidate pairs, and selection of a usable path. Observing where progress stops helps distinguish a signaling defect from an ICE-path problem. Statistics vary by browser and version, and missing fields are not automatically zero.
Freeze the reproduction conditions and start collecting evidence early
Record browser and version, operating system, network type, time, and the exact reproduction sequence. In Chrome, open chrome://webrtc-internals before the call and keep it open while reproducing the failure; the WebRTC project’s bug-report guide recommends downloading PeerConnection updates and statistics for connectivity issues. Functional ICE problems may also require native logs. Keep timestamps for signaling messages, local and remote description results, candidate events, and connection-state changes.
A product’s “connecting” label does not reveal whether candidates were gathered, delivered, or checked. Preserve the diagnostics needed to compare events, but treat dumps as sensitive: candidate addresses and identifiers can expose network information. Redact or restrict access before sharing logs outside the debugging team.
Separate local gathering from delivery over signaling
Start with iceGatheringState and candidate events. If gathering is still in progress, more candidates may arrive. If it completes without visible candidates, inspect ICE-server configuration and the application’s permission and network context; that observation alone does not prove that a firewall or NAT caused the failure. Implementations can limit or obscure candidate details, so an application’s visible list is not a complete inventory of the network.
Then compare what the application sent with what it received from the peer: candidate counts, session identifiers, ICE generation, parsing results, and timestamps. With trickle ICE, descriptions and candidates can arrive at different times; an application that drops a valid early or late candidate may create a signaling-layer failure. A locally generated candidate is not evidence that the peer received it or that a connectivity check succeeded. If remote candidates are absent, investigate signaling delivery first. If both endpoints show candidates, move on to pair checks.
Read candidate-pair state as a timeline
The candidate-pair entries returned by getStats() provide a view into checks. The W3C WebRTC Stats Editors’ Draft (a proposal, not an adopted Recommendation) defines states including frozen, waiting, in-progress, succeeded, and failed. Compare successive samples to see whether a pair is waiting, a check started, or a response arrived. A state is not by itself a guarantee that the user-facing call works. Fields such as requestsSent, responsesReceived, and currentRoundTripTime may be absent in some implementations or situations; do not silently interpret absence as zero.
Follow candidate IDs from each pair to the corresponding local and remote candidate statistics. Candidate type and protocol can suggest what to test next. For example, comparing host, server-reflexive, and relay candidates may help isolate where paths differ, but a candidate type alone does not prove the root cause. No successful pair may point toward unreachable checks, yet it cannot identify a particular router or network policy without additional evidence. TURN allocation results, credentials, and service-side logs require separate checks by the application and TURN operators.
Confirm the selected path and verify application traffic separately
Once a path is selected, follow the transport and candidate-pair reference IDs in the statistics report. Compare nomination, byte counters, response counts, and timestamps over time. Some implementations expose selection through different fields, so avoid treating one browser-specific property as a universal interface. A selected pair confirms a transport-path observation, not successful delivery to the application’s intended recipient. If bytes or application messages do not move, inspect data-channel state and the remote application’s handling separately.
For intermittent failures, retain samples before and after an ICE restart or path change. Candidate-pair objects and identifiers can change during a restart; a single snapshot loses that history. Compare repeated attempts by browser version and network context, and report sample size with observed success rates. This process narrows hypotheses. A statistics dump by itself cannot prove that a particular NAT, firewall, or vendor device is defective.
Expert perspective: keep missing measurements and privacy visible
The W3C WebRTC Stats Editors’ Draft (not an adopted Recommendation) describes stats as snapshots and says unsupported or inapplicable members may be omitted. The WebRTC project’s bug guide asks reporters to include reproduction steps, browser and operating-system versions, and connectivity logs. Record an omitted field as unavailable rather than converting it into a zero or a failure. Diagnostic dumps can expose network identifiers, so restrict access.