The Water Cycle Connects Multiple Reservoirs
Beyond the simple evaporation–cloud–rain diagram, how oceans, air, ice, soil, and vegetation store and move water—and what observations can establish.
Publication & corrections: infostoa · Editorial standards
Individual author and specialist reviewer information is not provided for this article.
The water cycle is not one loop: water moves among reservoirs in the atmosphere, ocean, and land.
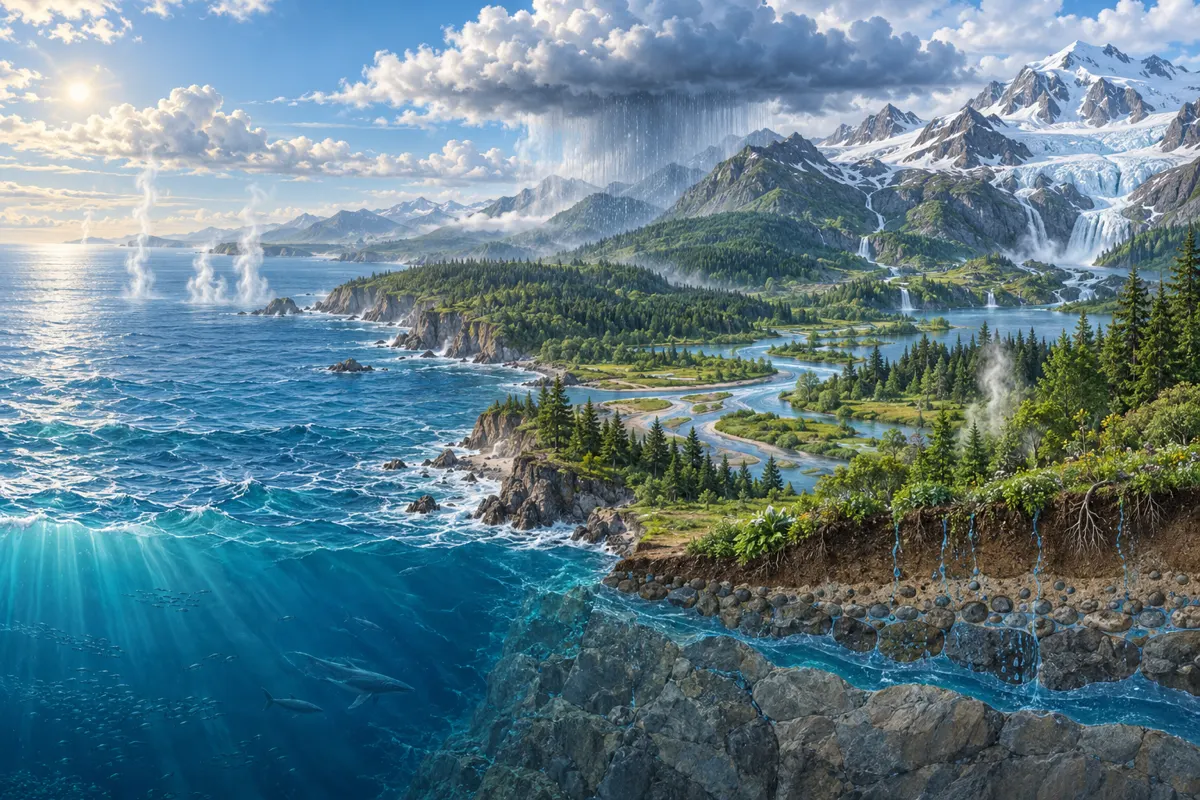
1. The water cycle is not one simple loop
A familiar diagram shows water evaporating from the ocean, forming clouds, falling as rain, and returning to the sea. NOAA says this circular sequence is useful for teaching, but water also moves among many reservoirs: clouds, oceans, lakes, vegetation, snowpack, and glaciers. Water does not follow one route, and it can remain in different reservoirs for different lengths of time. A loop diagram compresses major pathways; it is not a literal itinerary followed by every water molecule.
2. Several pathways link evaporation and precipitation
Solar energy changes surface water into vapor. As moist air cools, vapor can condense into droplets or ice crystals. Precipitation may infiltrate soil, run across the surface into streams and oceans, or be stored as snow and ice. Vegetation also returns water to the atmosphere. NASA observations help researchers examine how storage and movement vary across the planet. A single arrow or process cannot account for the entire water balance of a region.
3. Distinguish a reservoir from a flux
A reservoir describes where water is stored and how much is present at a time; a flux describes how much moves between reservoirs over a period. Lake level or soil moisture concerns a stored state, while rainfall and runoff describe flows. A large reservoir can remain steady when inflow and outflow are both high; a smaller one can decline quickly when outflow exceeds inflow. One rainfall observation therefore cannot establish drought or flood risk on its own.
4. Satellites measure parts of a global system
NASA uses satellite observations to study precipitation, clouds, ice, land, and changes in water storage. Instruments measure different quantities and spatial scales, so one satellite map does not directly show every aquifer, soil layer, and stream. NOAA describes water-cycle information as useful for weather and water-supply prediction and for monitoring drought and floods, but such forecasts combine multiple datasets and agency expertise. Observations still require interpretation through models and, where available, ground measurements.
NOAA explains that warmer air can hold more water vapor before it becomes saturated and condenses. This can mean longer intervals between rain events while some rainfall events become heavier. It does not let temperature alone predict a local flood or drought; it describes how atmospheric moisture and rainfall timing can shift together.
5. The same rainfall can produce different local responses
Where water goes after rain depends on soil, geology, vegetation, slope, prior moisture, and infrastructure. NOAA notes that river-flood prediction considers precipitation and runoff potential as well as surrounding geology and vegetation and groundwater inputs. The same rainfall amount therefore does not produce an identical flood response or groundwater recharge in every watershed. A water-cycle diagram teaches connections; assessing a local hazard requires watershed-specific evidence.
6. Expert perspective: read pathways alongside measurements
Separating reservoirs, routes, and measurement periods helps avoid confusing causes and outcomes. If streamflow does not rise immediately after rain, water may have been stored in soil, snow, or groundwater, or returned through evaporation and vegetation. These are possible pathways, not a diagnosis of a particular watershed. A sound explanation checks the scope and uncertainty of field observations, satellite products, and hydrological models together.
NASA estimates Earth contains about 1.39 billion cubic kilometres of water, with roughly 96.5% in the oceans. Polar ice, glaciers, permanent snow, and groundwater account for much smaller shares, while atmospheric vapor is a very small fraction of the total. A small reservoir can still have major effects on weather and climate, so storage volume and process importance are not the same measure. Most ocean water is also saline rather than immediately usable freshwater, and accessible freshwater is unevenly located. These are NASA’s global estimates, not a description of the water supply in any specific region. NASA also explains that water vapor carries latent heat through evaporation and condensation, affecting weather and climate despite its small share of total water.