Tide gauges and satellites: reading sea-level differences
Land references, ocean coverage and observation periods explain why coastal and satellite records can differ.
Publication & corrections: infostoa · Editorial standards
Individual author and specialist reviewer information is not provided for this article.
Tide gauges measure water relative to coastal land; satellites describe sea-surface height across broader ocean areas. Their records answer different questions, so a difference need not be a contradiction. NOAA overview
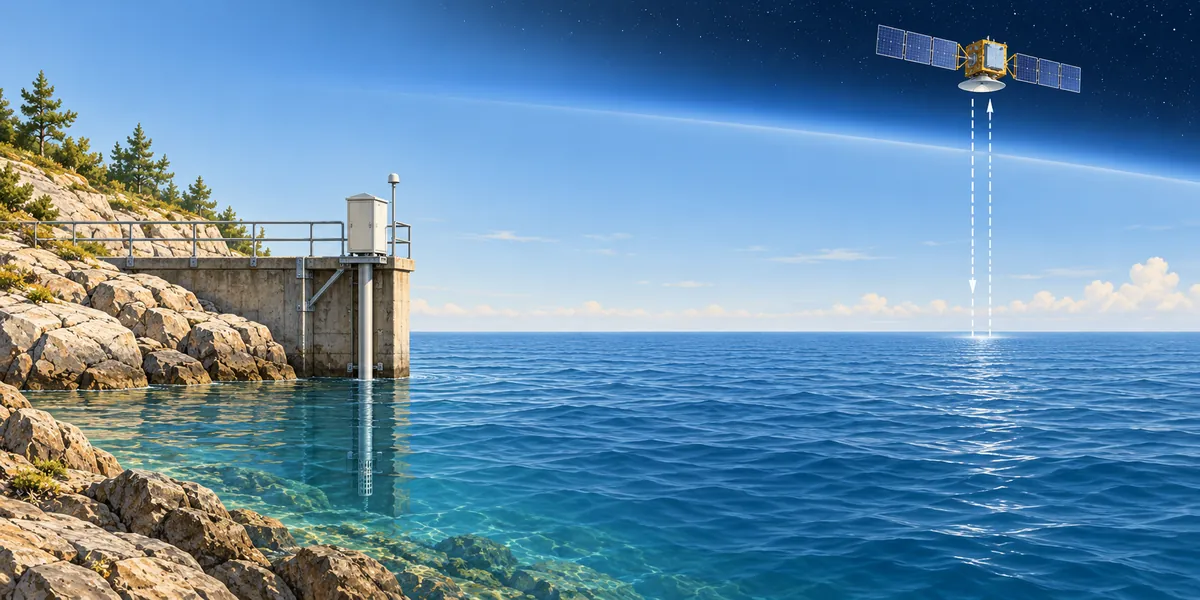
Conceptual illustration; not to scale.
The reference is part of the measurement
A height needs a starting level, called a datum. NOAA’s definitions distinguish mean sea level from mean high or low water. These are local references, linked to benchmarks. A value above a station’s zero is therefore not automatically comparable with a value above another reference. NOAA datums
A long record also needs continuity in that reference. PSMSL adjusts monthly and annual station means using their datum histories to form its Revised Local Reference dataset. Its guidance generally favors these records for time-series analysis; an undocumented change of zero can otherwise resemble a change in water level. PSMSL reference
The water-level sensor is another part of the system. NOAA’s acoustic example times a signal reflected from the water surface; older instruments used floats. Weather measurements can accompany the water readings. Recording wind or pressure alongside height provides context for interpreting a temporarily unusual reading at the station. NOAA instruments
From an orbital distance to an ocean mean
For satellite altimetry, a radar pulse’s return time gives range to the sea surface. Independently determined orbital height provides the other quantity. Subtracting corrected range from that height yields sea-surface height in an Earth-centered frame. NASA’s verification sites combine surveyed positions with local gauges to check the satellite measurements. NASA technology
Corrections matter because the pulse does not travel through an empty path. Water vapor and charged particles can delay it. Gravity and ocean circulation also shape the ocean surface. A satellite map is therefore a map of a physically uneven surface, not a measurement of one flat, universal waterline. NASA topography
A global indicator requires an additional averaging step. NASA’s documented product area-weights gridded sea-surface anomalies, with a series beginning in 1993 and coverage between 66 degrees south and north. It also specifies smoothing and excludes glacial isostatic adjustment. Those processing choices belong with the graph when comparing datasets. NASA dataset
Land movement changes the coastal reading
A gauge alone cannot separate rising water from sinking land. Consider a deliberately illustrative case: water rises two centimeters while the benchmark falls one centimeter. The relative increase is three centimeters, although water rose only two. These are invented numbers for the reference relationship, not an observed rate or forecast. PSMSL land signals
The land term has several mechanisms. Sediment compaction can lower a coast; tectonic movement can raise or lower it. Land can also rebound after the loss of an ice load. NASA’s explanation treats these as contributors to vertical land motion, so a coastal difference does not identify one cause by itself. NASA land motion
Additional observations help separate the terms. NASA describes GNSS stations that measure land movement, alongside gauges with frequent coastal observations and some records longer than a century. Their strengths differ from orbital sampling. Combining them extends the picture; a long gauge record and a recent satellite record still have different histories. NASA observing tools
A high water reading is not a trend
Local winds can push water toward shore or away from it, while atmospheric pressure changes water level. Bays, inlets and river flows also modify the local tidal pattern. NOAA’s explanation makes clear why a single high reading, especially in unusual weather, cannot stand in for a long-term sea-level trend. NOAA weather effects
Read the labels before comparing lines
First identify the plotted quantity: absolute height, change, or anomaly. NASA’s 2019 paired visualization labels anomalies relative to a 1993–2018 mean and distinguishes them from global mean sea level. An anomaly’s zero denotes its stated reference period. Next compare place, dates and averaging, rather than judging differences from line height alone. NASA graph example
Sources
- NOAA — Is sea level rising?
- NOAA CO-OPS — Tidal Datums
- PSMSL — Revised Local Reference Definition
- NOAA National Ocean Service — How are Tides Measured? The New System
- NASA JPL — Technology
- NASA JPL — Ocean Surface Topography
- NASA PO.DAAC — NASA-SSH Global Mean Sea Level from Simple Gridded Sea Surface Height
- NASA JPL PO.DAAC — Sea Surface Height Anomalies and Global Mean Sea Level
- PSMSL — Geophysical Signals in Tide Gauge Data
- NASA — What Causes Local Sea Level Change? Dive Deeper
- NASA — How Do We Measure Sea Level Change? Dive Deeper
- NOAA National Ocean Service — What Affects Tides in Addition to the Sun and Moon?