How Plate Boundaries Shape Earthquakes, Volcanoes, and Mountains
Learn how plates diverge, converge, and slide, what seafloor magnetic stripes reveal, and where landscape-based interpretations have limits.
Publication & corrections: infostoa · Editorial standards
Individual author and specialist reviewer information is not provided for this article.
Earth’s rigid outer layer is divided into plates that move slowly relative to one another. Where plates separate, converge, or slide past each other, they can shape earthquakes, volcanoes, and mountain ranges—but a boundary does not produce the same features everywhere.
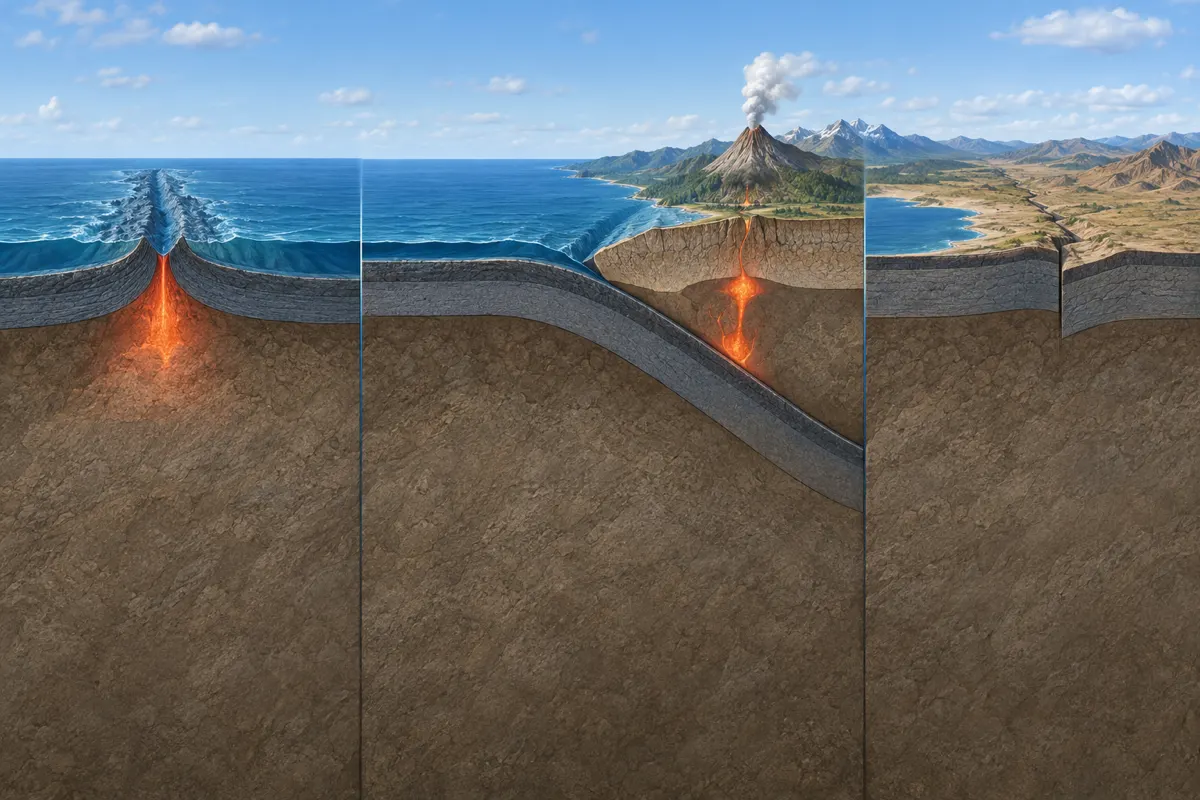
Earth’s outer layer moves as plates
The U.S. National Park Service (NPS) describes Earth’s thin outer layer as divided into plates that move relative to one another. A plate includes crust and rigid uppermost mantle, together forming part of the lithosphere. A boundary is not always a razor-thin line; it can be a broad zone where rocks deform and geologic activity concentrates. The motion is generally too slow to notice directly, yet over geologic time it changes the arrangement of continents and ocean basins.
Three broad kinds of boundary motion
At a divergent boundary, plates move apart and magma may cool to form new oceanic crust. At a convergent boundary, plates move toward one another; denser oceanic lithosphere can descend beneath another plate, a process called subduction. When two continents converge, their relatively buoyant crust resists sinking, so it may buckle, thicken, and contribute to mountain building. At a transform boundary, plates mostly slide horizontally past each other. Real boundaries vary with the lithosphere involved and the surrounding structures.
Magnetic stripes record earlier motion
The U.S. Geological Survey (USGS) explains that magnetic stripes on the ocean floor preserve evidence of reversals in Earth’s magnetic field. As lava cools, magnetic minerals can retain an orientation; comparing patterns on either side of a ridge helps scientists reconstruct the creation and movement of oceanic crust. These patterns provide evidence over geologic time, beyond what can be measured during a short modern survey. They do not, by themselves, identify the date of a future earthquake; rates depend on the locations, records, and time interval being analyzed.
Connect earthquakes and volcanoes to boundary type
NPS links interactions at plate boundaries with earthquakes, volcanoes, and mountain ranges. That does not mean every boundary has volcanoes or that all plate-edge earthquakes behave alike. At subduction zones, a descending plate can influence magma generation and volcanic activity; along transform boundaries, sliding and fault motion are central features. Understanding a particular region requires its boundary geometry and observations rather than a single global rule.
Expert perspective: combine evidence from different timescales
USGS’s account uses seafloor magnetic records to explain how earlier plate motion can be inferred, while NPS connects boundary interactions to visible landforms and geologic activity. These sources address complementary timescales. Modern measurements of plate motion and older ocean-floor records can support the same broad framework, but neither gives a calendar date for an individual earthquake. Interpreting plate tectonics means asking what each boundary type, observation period, and geologic record can establish.
Limits of reading boundaries from landscapes
Trenches, ridges, mountain belts, and volcanic arcs can help geologists investigate plate motion, but one landform alone rarely describes every process at a boundary. Geologists compare rock evidence, topography, earthquake patterns, magnetic records, and modern geodetic measurements. Each record captures different periods and processes, so a map or single example cannot explain every detail of a complex region.
USGS explains that present-day plate motion can be measured, while magnetic stripes combined with the approximate duration of magnetic reversals yield an average spreading rate over a selected interval. Its examples range from less than 2.5 cm per year at the Arctic Ridge to more than 15 cm per year at the East Pacific Rise near Easter Island. Those are ridge-specific averages, not a speed shared by every plate boundary.
USGS also notes that some boundaries are broad deformation zones rather than simple lines. Small plate fragments can occur within them, creating complex geologic structures and earthquake patterns. A line on a map therefore should not be mistaken for a complete description of the physical boundary.