What the Keeling Curve Measures—and What It Cannot Tell You
The Keeling Curve tracks atmospheric carbon dioxide at Mauna Loa, showing a seasonal cycle on top of a long-term rise. Learn how monthly values are formed and how to distinguish direct observations from broader climate interpretations.
Publication & corrections: infostoa · Editorial standards
Individual author and specialist reviewer information is not provided for this article.
A record of measured atmospheric carbon dioxide
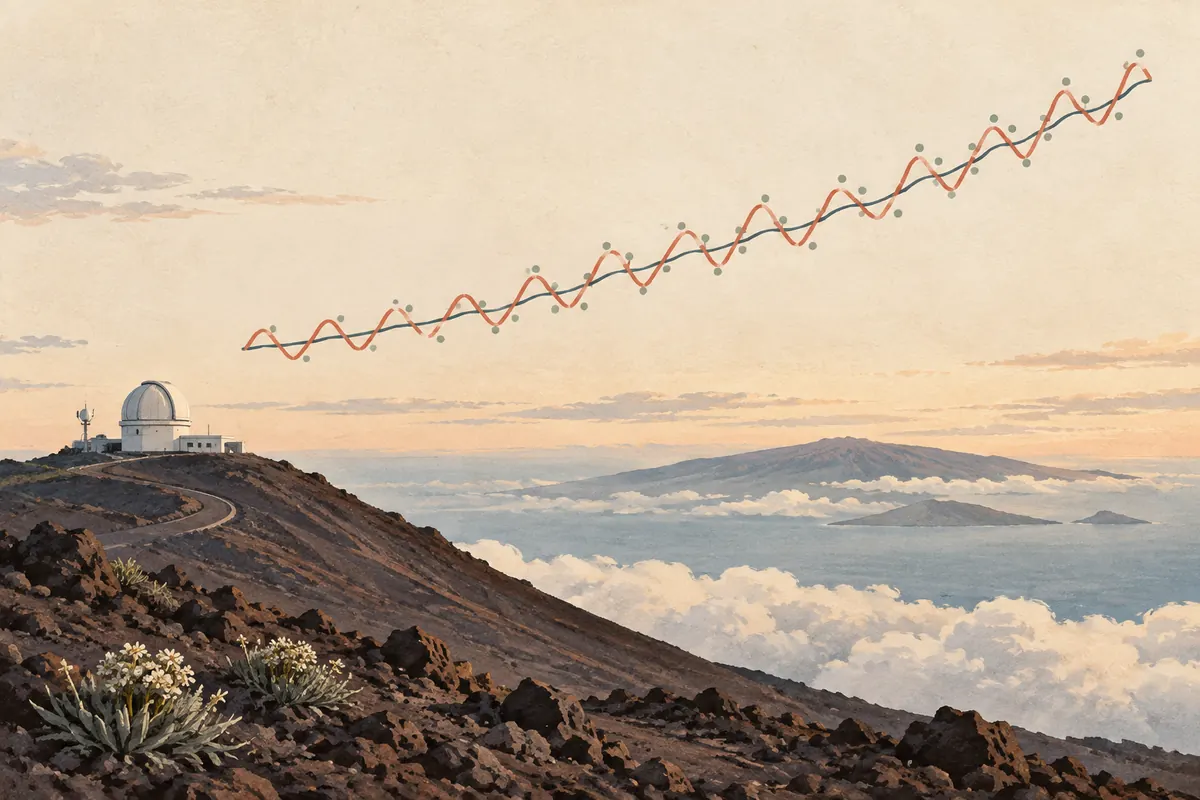
The Keeling Curve plots atmospheric carbon dioxide (CO₂) concentration over time. The long record from Hawaii’s Mauna Loa Observatory began in March 1958 and became one of the best-known records of changing atmospheric composition. The curve is named for Charles David Keeling, the ocean chemist who led the early measurements. Its defining feature is that the plotted record comes from air analyzed at an observatory; it is not a reconstruction of past climate.
NOAA suspended measurements at Mauna Loa Observatory on November 29, 2022, because of the volcanic eruption. Observations from December 2022 through July 4, 2023 came from the Maunakea Observatories site about 21 miles north; Mauna Loa measurements resumed in July 2023. The long record beginning in 1958 therefore should not be described as uninterrupted measurement at one site.
The vertical scale is commonly expressed in parts per million, or ppm: the number of CO₂ molecules in a million molecules of dry air. A value of 420 ppm therefore means roughly 420 CO₂ molecules per million dry-air molecules. It does not directly state the total mass of greenhouse gases or the concentration at every place on Earth. Identifying the measured quantity is the first step in comparing charts correctly.
The seasonal sawtooth has a biological rhythm
A repeating up-and-down pattern sits on top of the long-term rise. The Northern Hemisphere has extensive land and vegetation. During spring and summer, growing plants take up carbon through photosynthesis, and atmospheric CO₂ tends to fall. In autumn and winter, uptake weakens while respiration and decomposition continue, so concentrations tend to rise. This seasonal cycle is a different signal from the longer-term balance of emissions and absorption.
Comparing one month with a nearby month in another year can therefore mix the long-term change with different positions in the seasonal cycle. NOAA presents monthly mean observations alongside a series corrected for the average seasonal cycle. That corrected line is not a separate observation with the seasons physically removed. It is a statistical presentation that uses recurring patterns across years to make the underlying trend easier to see. The raw and corrected series answer different questions.
Expert perspective: read the measurement process and uncertainty
A monthly mean is more than one instantaneous reading. NOAA explains that daily concentrations vary as different weather systems pass the observatory and connects that variability with uncertainty in each monthly mean. Its seasonal correction also uses repeated cycles from adjacent years. Knowing these steps helps prevent two common mistakes: assigning too much meaning to a small month-to-month change and treating the smoothed or corrected line as if it were the untouched measurement.
Ralph Keeling, director of the Scripps CO₂ Program, explained that day-to-day variability in the Mauna Loa record was unusually pronounced in the first half of 2024 and was almost entirely connected with large-scale weather patterns. This is a concrete example of why short-term movement should not automatically be read as a reversal of a long-term trend. His explanation concerns that 2024 record and does not assign the cause of every year’s variability. An expert perspective checks measurement location, time averaging, seasonal treatment, and uncertainty together.
From Mauna Loa to global conclusions
The sustained rise at Mauna Loa directly documents an increase in atmospheric CO₂ over many decades. A single station’s curve cannot, by itself, map every regional concentration difference or assign separate contributions to individual sources. The observatory is high above the surrounding landscape and is intended to limit some local influences, but one location is not a complete sample of every part of the globe. Global patterns and source attribution require networks of observations and other evidence about atmospheric transport and the carbon cycle.
The slope also need not be identical every year for the long-term rise to persist. Uptake by oceans and land ecosystems, together with weather and climate variability, can affect the annual pace of atmospheric increase. Conversely, one unusually large annual rise is not enough to identify a single event as its cause. Comparing multiple years and independent carbon observations gives a sounder basis for interpretation.
Four checks for reading the graph
First, check that the unit is ppm. Second, distinguish the observed monthly mean from a seasonally corrected series. Third, see whether the latest value is preliminary or has completed review. Fourth, do not treat a point measurement at Mauna Loa as interchangeable with a global average or an emissions estimate. These distinctions separate what the curve directly records from questions that need additional analysis.
Sources
- NOAA Global Monitoring Laboratory, “Trends in CO2” — Mauna Loa monthly means, the long direct-measurement record, seasonal-cycle correction, and variability in monthly means.
- Ralph Keeling, Scripps CO₂ Program Director, “Note on recent increased day-to-day variability” — explanation of daily Mauna Loa CO₂ variability in 2024 and its connection to large-scale weather patterns.