Distributed Trace Sampling: Decide Early or Decide After the Trace
Head sampling decides early and reduces telemetry volume, but can miss an error that occurs later. Tail sampling evaluates all or most spans before choosing, at the cost of buffering, routing, and operational capacity.
Publication & corrections: infostoa · Editorial standards
Individual author and specialist reviewer information is not provided for this article.
Keeping every trace can increase telemetry volume and cost, so systems choose which traces to retain. Head sampling decides near the start; tail sampling waits until spans arrive and evaluates conditions such as errors, latency, or attributes. Tail sampling can target exceptions, but it does not guarantee every error trace will be captured.
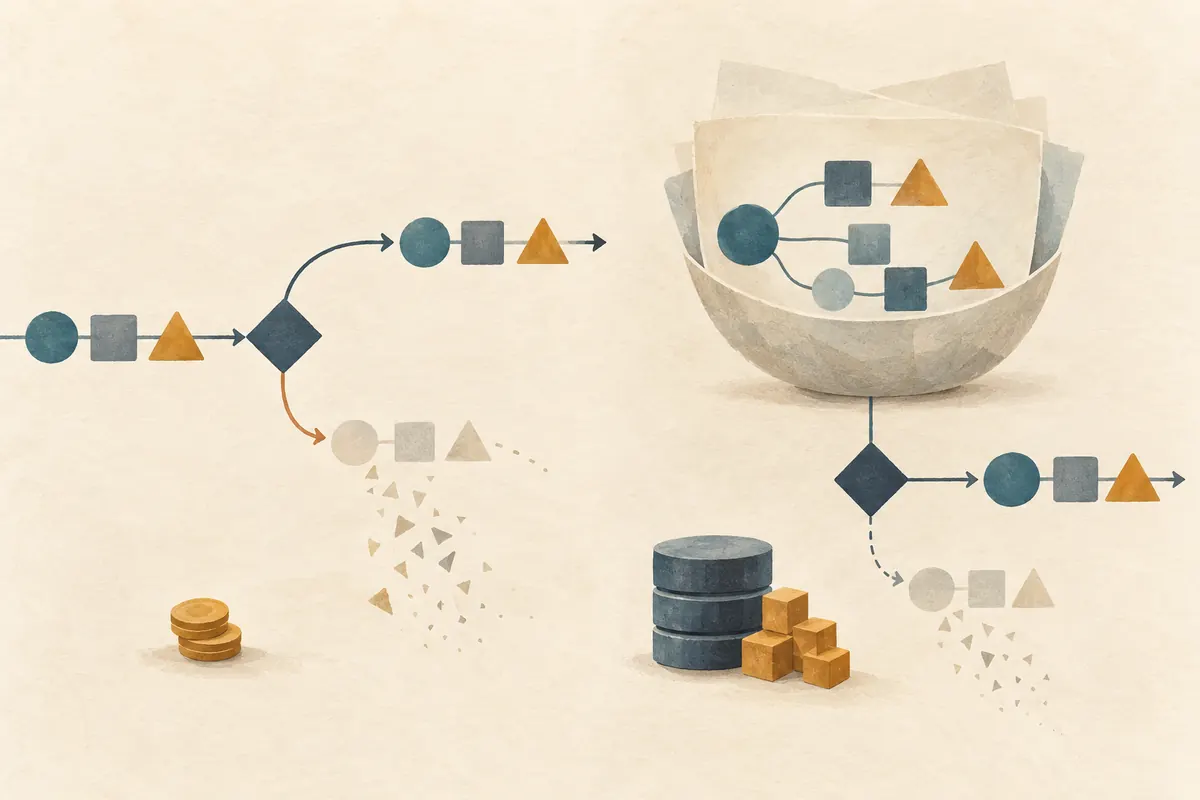
Head sampling makes an early decision
A head sampler chooses whether to keep data before it knows the complete trace. Consistent probability sampling can use trace identity so spans belonging to one trace follow the same decision. If a trace is dropped at the start, an error that occurs later may never reach the collection pipeline.
This approach is relatively simple and can reduce volume before data enters later parts of the pipeline. When most requests are similar and successful, a representative sample can describe normal behavior. But a rare failure can be discarded at the same rate as any other request, so head sampling alone cannot promise to retain all traces with errors.
Tail sampling evaluates assembled trace data
A tail sampler makes its choice after considering all or most spans for a trace. It can use conditions visible across the trace, such as overall latency, an error status, or an attribute on a particular span. A policy might retain a higher proportion of traces meeting an error or latency condition while sampling ordinary traces at a lower rate.
For the policy to act on the outcome, spans must reach the decision point. Data already dropped by an application SDK cannot be recovered by a Collector tail sampler. Combining a lower upstream sample rate with a downstream tail policy may control cost, but a trace removed upstream is no longer available for an exception rule.
Assembling traces requires memory and routing
Spans from one distributed request can arrive from several services at different times. A tail sampler holds data while it waits to see enough of a trace, so resource use depends on traffic, delay, and the decision window. If spans with the same trace ID are split across sampler instances, each may make a choice using partial information.
A Grafana Labs case study from 2020 described routing spans so those with the same trace ID reached one Collector instance when scaling out. It documents a historical, vendor-specific implementation and should not be treated as current configuration guidance. The broader design requirement is to bring necessary spans into one stateful decision path and define what happens when a trace remains incomplete.
A policy should track what it still misses
A rule that prioritizes traces containing errors does not guarantee that every error will be retained. Missing spans, full queues, memory limits, decision timeouts, broken trace context, and Collector failures can prevent the sampler from seeing a complete trace. Monitor capacity and incomplete-trace behavior alongside retention rates.
Sampling is a tradeoff about which evidence is more likely to remain when observation resources are limited. A representative traffic sample and a record of rare failures serve different purposes. Instead of specifying only a percentage, state which errors, latency patterns, or attributes matter and which cases the policy can still miss.
Choose for the traffic and the investigation
Start by locating where telemetry volume creates cost. Head sampling can reduce data before it enters a pipeline; tail sampling may fit when a decision needs later error or latency information, provided the system can support buffering and routing. A design can combine both, but a trace dropped earlier cannot be selected downstream.
Begin with a limited policy and measure what remains from normal, failed, and slow requests, as well as how often traces fail to assemble. Observe Collector memory and queue behavior during traffic spikes. Check current SDK and Collector documentation for supported options and defaults; do not copy configuration from a 2020 case study as if it described today’s release.
Expert perspective: compare samples with request-wide signals
Sampled traces can help investigate causes, but they are not a complete ledger of requests. Pair them with aggregate signals collected before trace sampling, such as request counts, error rates, and latency distributions, to see whether a rare failure may have been missed. When changing a policy, compare those totals and incomplete-trace rates alongside the trace-retention rate.